BLOG
Pickup time: What it is and why you should track it
12 November 2025 | Customer data; Ticket sales
12 November 2025 | Customer data; Ticket sales
How much do you know about pickup time? Understanding what pickup time is (spoiler alert: the time between ticket purchase and event), what your events’ pickup times look like, and how to use that data is extremely valuable. These numbers reveal trends and patterns in purchasing behavior – insights you can use when developing pricing strategies and communication plans for upcoming events.
In this blog post, you’ll get an introduction to pickup time in the event industry – along with knowledge, data, and inspiration. You can also download our full report to dive even deeper!
Contents:
• What is pickup time?
• Why analyze pickup time?
• Three pickup time insights from the event industry
Download our latest report: "The MarketHype Report: Pickup time in the event industry".
In the event industry, pickup time refers to the time between when a ticket is purchased and when the event takes place. Pickup time tells you how early – or how close to the event – your customers are buying their tickets. A longer pickup time is desirable because it gives you a longer “in-between period” to sell more tickets, communicate with customers, and work with upselling opportunities.
Example: If your customer buys a ticket 50 days before the event takes place (regardless of whether ticket sales opened 60 or 100 days before), the pickup time is 50 days. That means you have 50 days to communicate with your customer, promote add-ons, and build engagement.
Here are four reasons why it’s worth understanding when your audience buys their tickets:
The most obvious reason: you want to sell out. You want to make sure every seat is filled and maximize your ticket revenue.
With pickup time data, you can see how ticket sales have performed in the past and get a better sense of what to expect for your next concert, match, or performance.
Pickup time data helps you plan communication, pricing, and campaigns at the right moment – when your audience is actually buying. It makes it easier to know when to push your ads and when to save your budget. You avoid wasting effort too early and can instead hit the right timing, message, and channels.
By selling tickets earlier, you improve your cash flow. The earlier your audience buys, the more paydays they’ll have before the event – and the more willing they’ll be to spend money both before and during the event.
Create multiple marketing touchpoints between purchase and event: share tips about food, merch, programs, upgrades, and add-ons – things that make the experience even more memorable (and boost your revenue).
A longer pickup time also reduces the risk of cancellations or no-shows. When a ticket is purchased early, it’s already locked into the customer’s calendar – meaning factors like bad weather, a birthday party, or a surprise visit from grandma are less likely to get in the way.

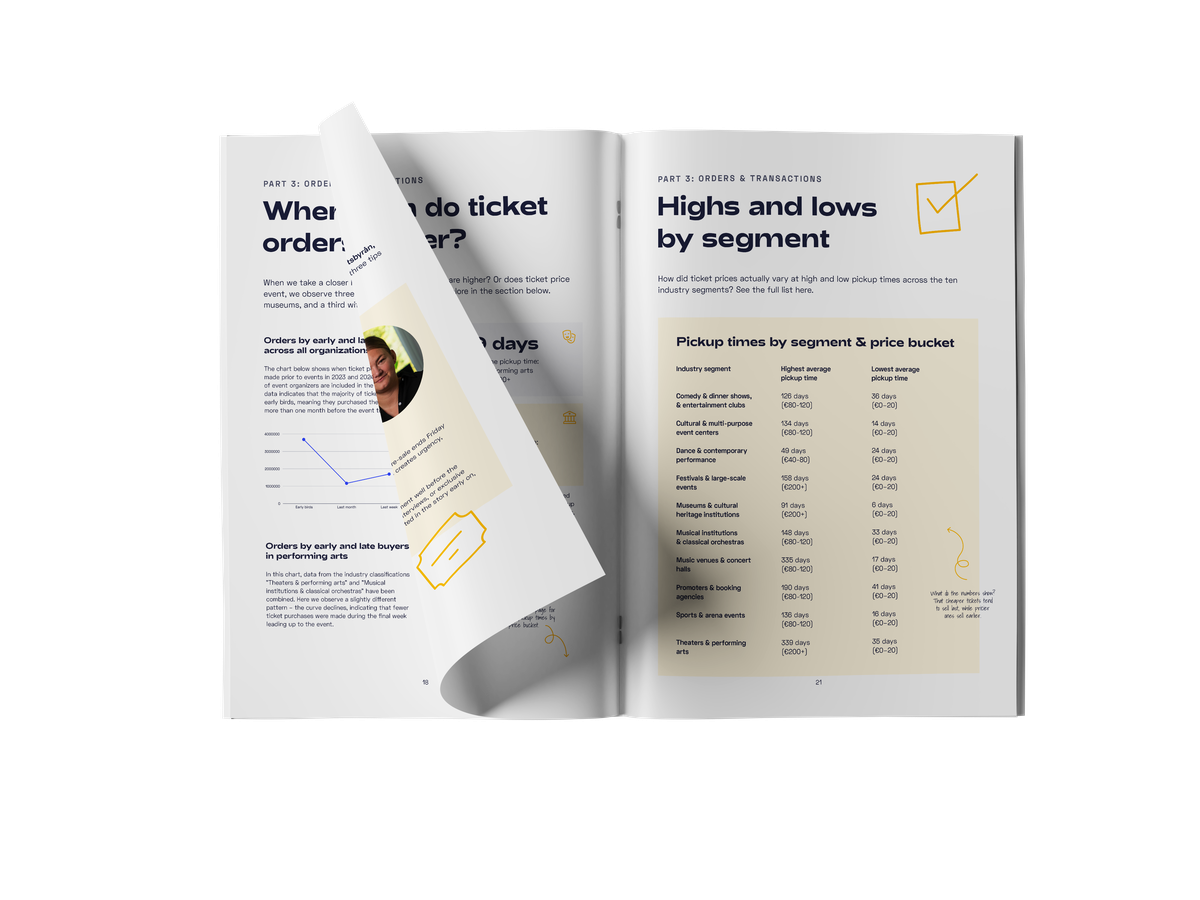
What does pickup time look like across the event industry? Here’s a selection of charts and statistics from our report "The MarketHype Report: Pickup time in the event industry"! (Download it for free.)
The report is based on data from 2023–2024 and analyzes pickup time and ticket purchases from event organizations across the Nordics. It covers ten industry segments, nearly seven million orders, and over four million unique contacts. All data originates from event organizers connected to MarketHype.

The chart above shows the number of orders placed each week before an event, during 2023 and 2024. The data includes ten different industry segments. As you can see, most orders (3 074 676) were placed during the final week before the event – and fewer the further away the event date was.
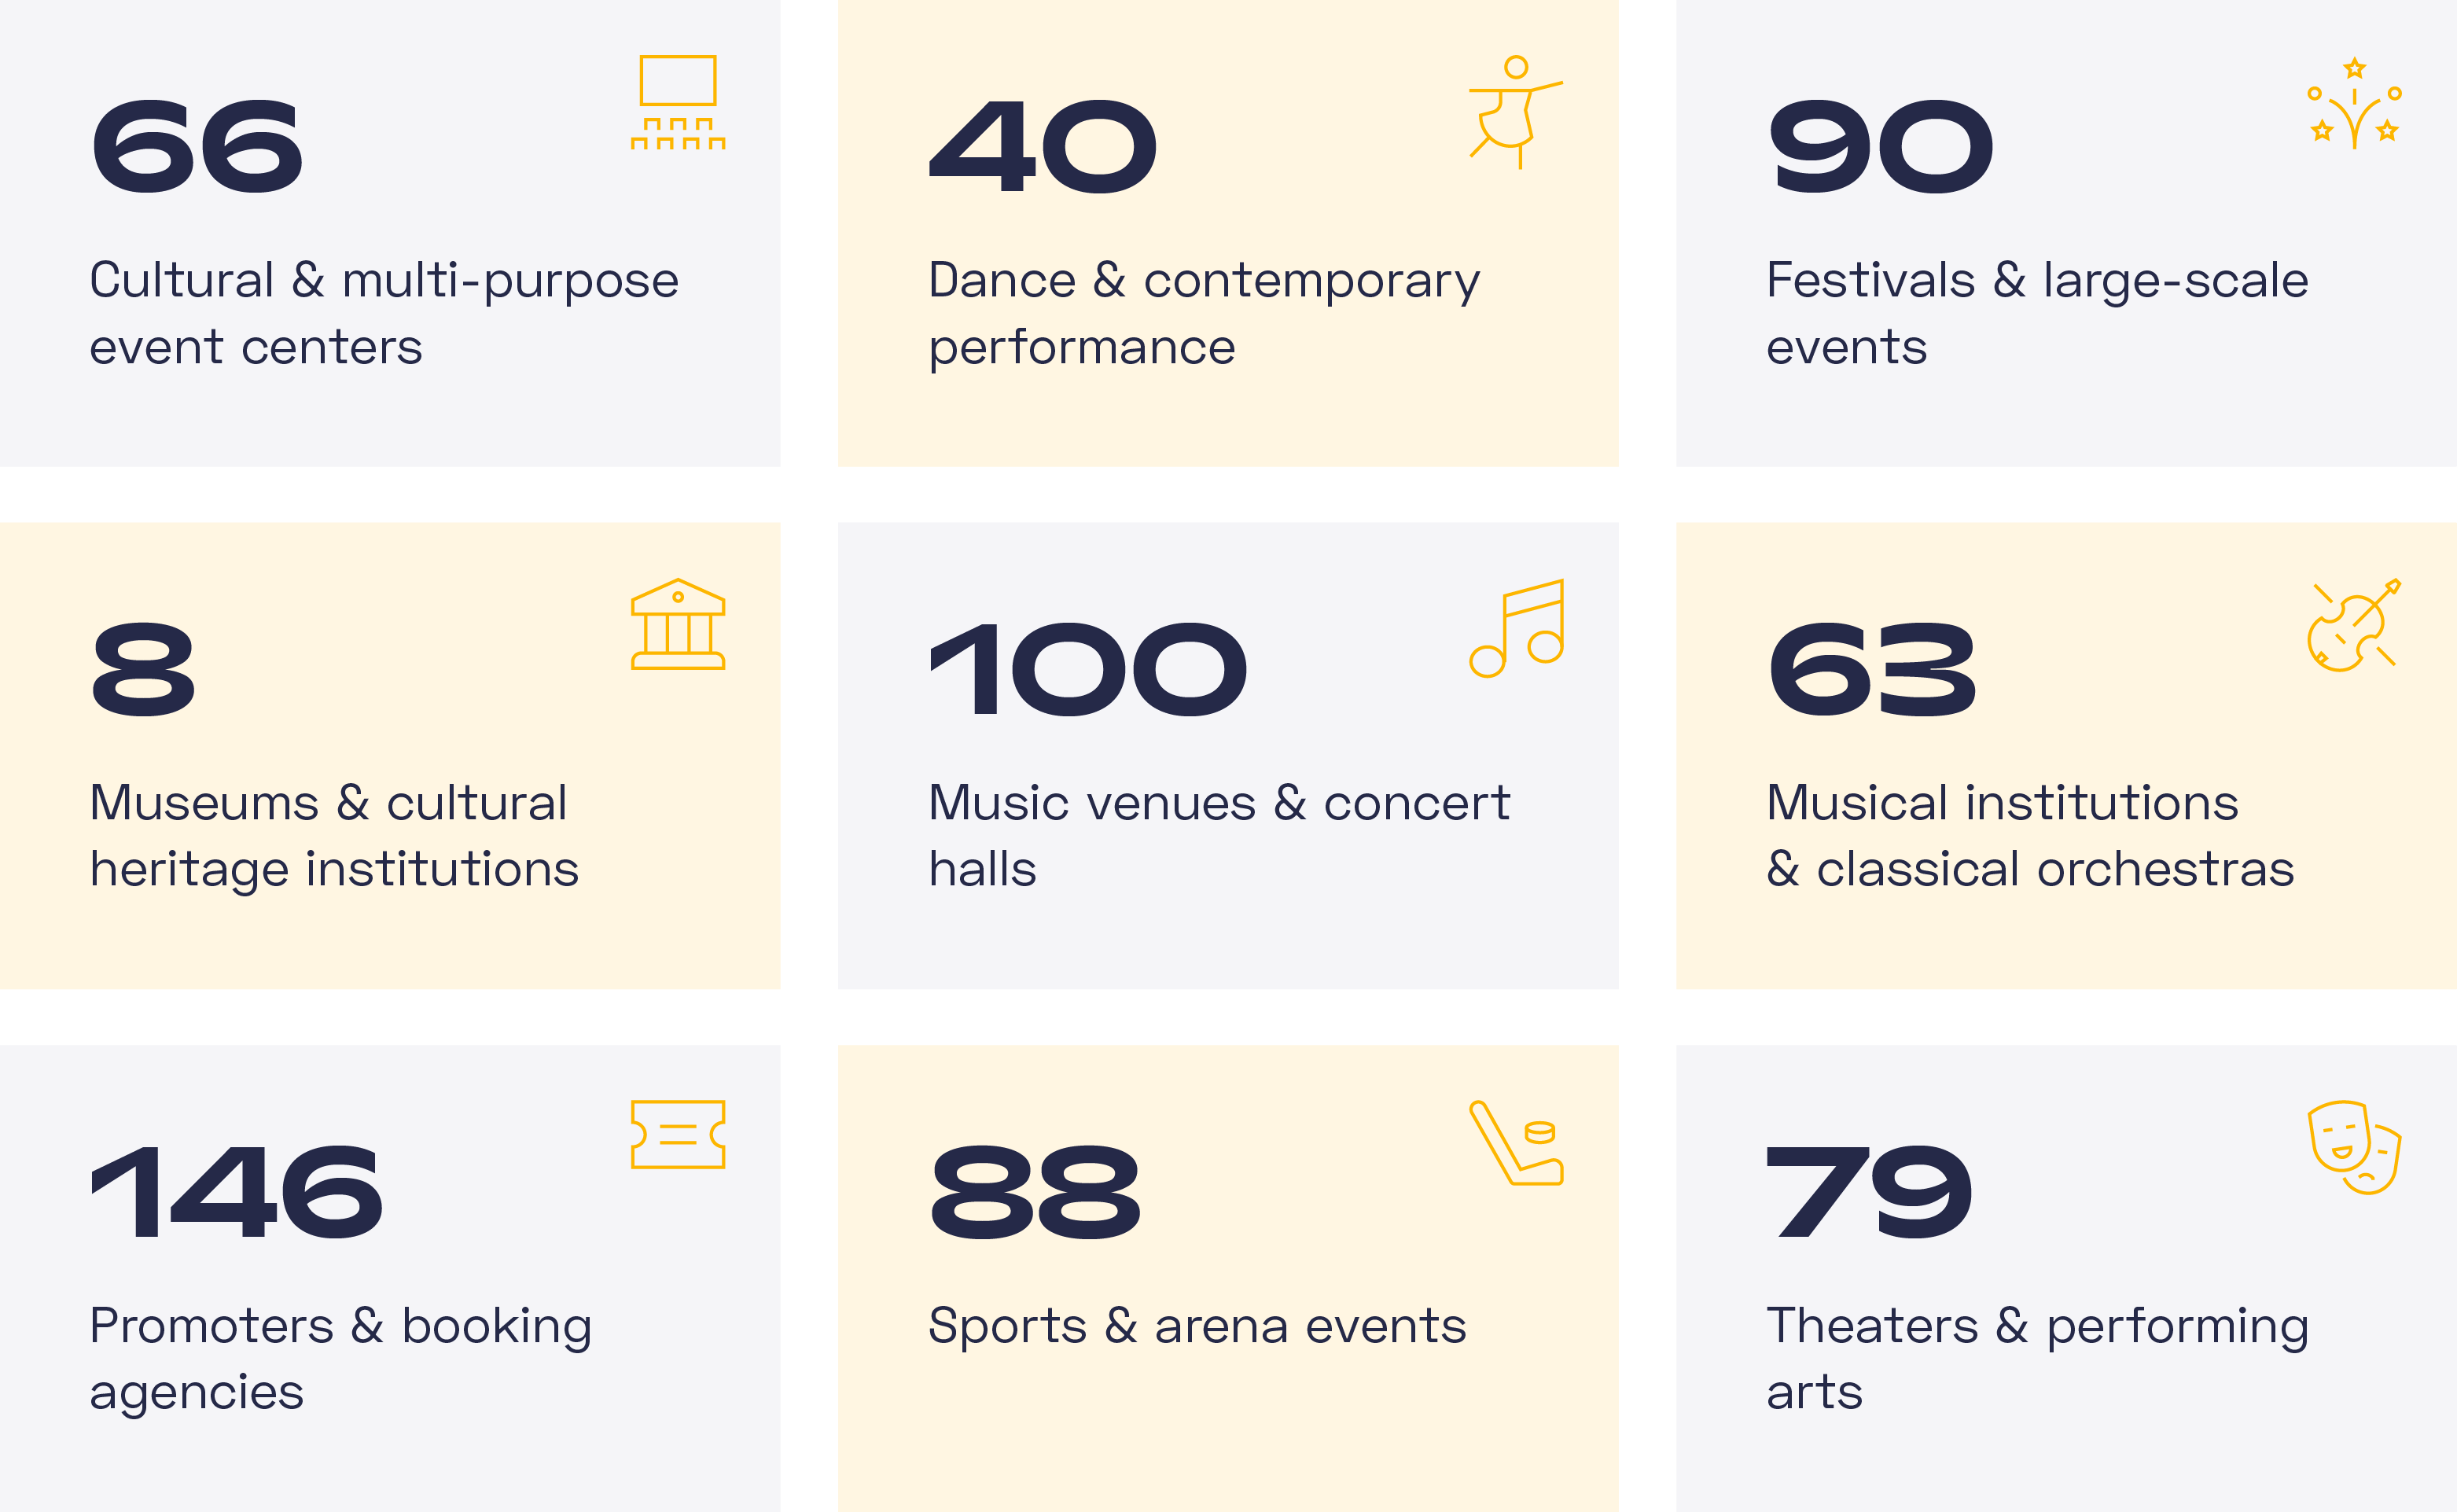
The boxes above show the average pickup time (in days) across nine industry segments, listed alphabetically. The shortest average pickup time was found among museums and cultural heritage institutions (8 days), while the longest was among promoters and booking agencies (146 days).

The X-axis in the chart above shows different ticket price ranges, and the Y-axis shows the average pickup time in days.
The pattern indicates a correlation between ticket price and pickup time, though not a strictly linear one. On average, tickets priced between €80–€120 were purchased the earliest (166 days before the event), while tickets priced between €0–€20 had the shortest pickup time (21 days).
Want more charts, insights, and interviews? Download "The MarketHype Report: Pickup time in the event industry" for free – and become a true pickup time pro!